According to Gary Stager, Seymour Papert described Mathland as a place inside of computing where one could learn to be a mathematician as casually as one would learn French by living in France Papert and his team developed LOGO, a programming language, in 1968 to engage youth in mathematics and to program computers to think. He believed students’ ability to think critically would increase if they thought about thinking – and programming a computer to think. Unfortunately, math phobia still exists today and I often wonder if
“I was never good at math”
is a direct result of the methods in which math is evaluated as a score.
The reality is, I DO want students to know that 5×7=35 but I also want them to know why 5×7=35 and how to apply 5×7=35 in their lives.
— Dan Allen (@AllenMath) September 11, 2017
Regardless, in the context of “old versus new” math, Like Dan Allen said this week,
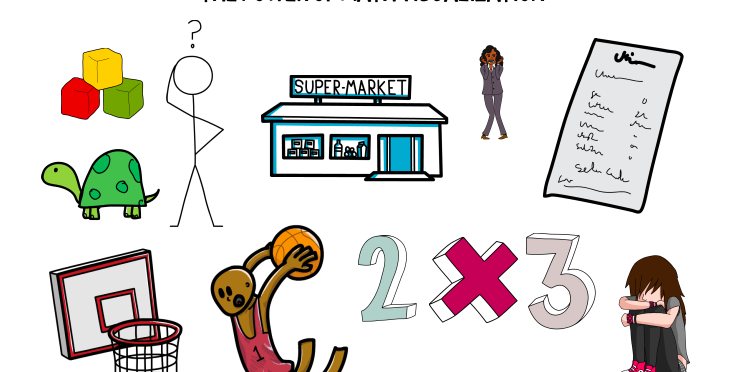
I want students to know 2×3=6,
why 2×3=6
and how to apply 2×3=6 to their daily lives
in order to better engage and have them invest in learning.
Check out a great piece by Matthew Oldridge:
In the battle of old versus new ways of teaching math, our kids are suffering
The Power of Visualization in Math
https://www.edutopia.org/article/power-visualization-math
 For all the kids who grow up in a small town and think they don’t stand a chance. You do. I was once that kid.